

By: Deborah O'Malley | Last updated December, 2023
If you've been into experimentation long enough, you've likely come across the term MDE -- which stands for Minimum Detectable Effect (MDE).
The MDE sounds big and fancy, but the concept is actually quite simple when you break it down. It's the:
As this GuessTheTest article explains, in order to run a trustworthy experiment -- one that's properly powered experiment, based on an adequate sample -- it's crucial you calculate you calculate the MDE.
But not just calculate it.
Calculate it AHEAD of running the experiment.
The problem is, doing so can feel like a tricky, speculative exercise.
After all, how can you possibly know what effect, or conversion lift you want to detect from the experiment?! If you knew that, you wouldn't need to run the experiment to begin with!
Adding insult to injury, things get even more hazy because the MDE is directly tied into your sample size requirements.
The larger the MDE, the smaller the sample size needed to run your experiment. And vice versa. The smaller the MDE, the bigger the sample required for your experiment to be adequately powered.
But if your sample size requirements are tied into your MDE, and you don't know your MDE, how can you possibly know the required sample size either?
The answer is: you calculate them. Both. At the same time.
There are lots of head spinning ways to do so. This article outlines a few.
But, if you're not mathematically inclined, here's the good news. . .
You can use a pre-test analysis calculator, like this one, to do all the hard work for you:

Now, as said, that's the good news!
The bad news is, even a calculator like this one isn't all that intuitive.
So, to help you out, this article breaks down exactly what you need to input into an MDE calculator, with step-by-step directions and screenshots so you'll be completely clear and feel fully confident every step of the way.
Let's dig in:
To work this calculator, you’ll need to know your average weekly traffic and conversion numbers.
If you’re using an analytics platform, like Google Analytics, you’ll be able to easily find this data by looking at your traffic and conversion trends.
In Google’s current Universal Analytics, traffic data can be obtained by going to the Audience/Overview tab:
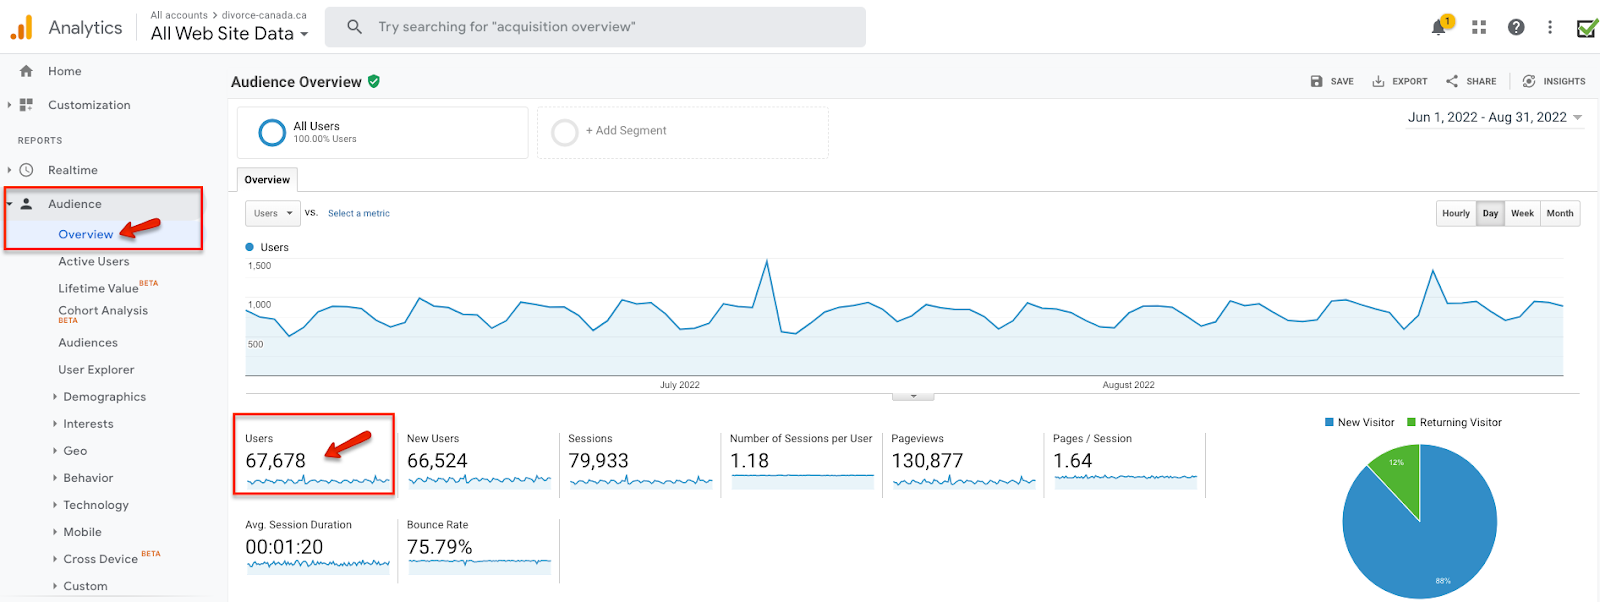
It’s, typically, best to take a snapshot of at least 3 months to get a broader, or bigger picture view of your audience over time.
For this example, let’s set our time frame from June 1 - Aug. 31.
Now, you can decide to look at these numbers three ways:
Given these differences, calculating the total number of users will probably give you the most accurate indication of your traffic trends.
With these data points in mind, over the 3-month period, this site saw 67,678 users. There are, typically, about 13 weeks in 3 months, so to calculate users per week you’d divide 67,678/13=5,206.
In other words, the site received about 5,206 users/week.
You’d then plug this number into the calculator.
To calculate the number of conversions over this time period, you’ll need to have already set-up conversion goals in Google Analytics. Here’s more information on how to do so.
Assuming you’ve set-up conversion goals, you’ll next assess the number of conversions by going to the Goals/Overview tab, selecting the conversion goal you want to measure for your test, and seeing the number of conversions:
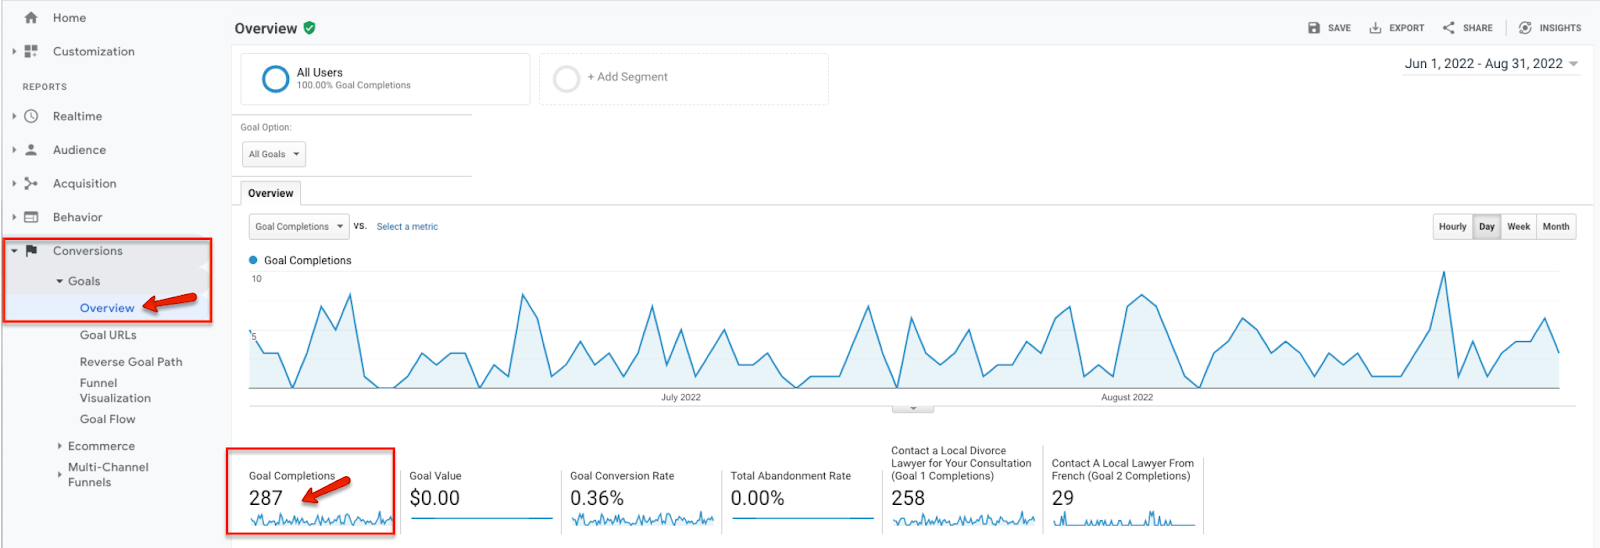
In this example, there were 287 conversions over the 3-month time period which amounts to an average of 287/13=22 conversions/week.
Now, imagine you want to test two variants: version A (the control, or original version) and B (the variant).
You’d now plug the traffic, conversion, and variant numbers into the calculator:

Now you can calculate your baseline conversion rate, which is the rate at which your current (control) version is converting at.
This calculator will automatically calculate your baseline conversion rate for you, based on the numbers above.
However, if you want to confirm the calculations, simpley divide the number of goals completed by the traffic which, in this case, is 22 conversions per week/5,206 visitors per week (22/5,206=0.0042). To get a percentage, times this amount by 100 (0.0042*100=0.42%).
You’d end up with a baseline conversion rate of 0.42%:

Next, plug in the confidence level and power at which you want to obtain results.
As a general A/B testing best practice, you want a confidence level of +95% and statistical power of +80%:

Based on these numbers, the pre-test sample size calculator is indicating to you that you’ll want to run your test for:

As a very basic rule of thumb, some optimization experts, like Ronny Kohavi, suggests setting the relative MDE with a range from 2-5%.
It's important to note, the upper bound of this range is up to a maximum of 5%.
If the experiment isn't powered enough to detect a 5% effect, the test results can't considered trustworthy.
However, it's also dangerous to go much beyond 5% because, at least in Ronny's experience, most trustworthy tests don't yield more than a 5% relative conversion lift.
As such, for a mature testing organization which large amounts of traffic and an aggressive optimization program, a relative 1-2% MDE is more reasonable and is still reason to celebrate.
In the example shown above, the relative MDE was 46.43%, which is clearly above the 5% best practice.
This MDE indicates traffic is on the lower side and your experiment may not be adequately powered to detect a meaningful effect in a reasonable timeframe.
In this case, if you do decide to proceed with running the test, make sure to follow these guidelines:
Hope this article has been useful for you. Share your thoughts and comments below:
A primer explaining the 4 different types of tests you can run, what they mean, and how you can use each to improve your competitive testing advantage.
One of the most debated testing topics is how large does my sample size need to be to get trustworthy test results? Some argue samples of more than 120,000 visitors per variant are needed to begin to see trustworthy test results. Ishan Goel of VWO disagrees. What does he think is needed to get trustworthy test results? Listen to this webinar recording to find out.
To get users clicking your content, which format works best: buttons or links. A series of 8 real-life A/B tests suggests one format consistently outperforms. Can you guess which version wins? Checkout the mini meta analysis to find out.


A useful article on explaining what's MDE, loved reading it! 🙂 What's not clear to me is that is a 5% MDE a relative change (e. g. from 10% to 10.5%)or a 5% percentage point increase (e. g. from 10% to 15%)?
Tamas - Great question. The answer will depend on whether you're looking to express the lift in absolute (10% to 10.5%) or relative (percentage point increase from 10% to 15%) terms. However, using the calculator shown in the example, the answer is the MDE should be a RELATIVE (10% to 10.5%) MDE.
Thanks for clarifying it! 🙂
When Ronny stated the below, which one was he referring to?
"However, it's also dangerous to go much beyond 5% because, at least in Ronny's experience, most trustworthy tests don't yield more than a 5% conversion lift."
Tamas - confirmed with Ronny. He's referring to RELATIVE. You've brought up a great point, and will update the article text so there's no confusion in the future. Thanks!
Hi Deborah,
Thank you again! One more question: in the article you write "If the experiment isn't powered enough to detect a 5% effect, the test results can't considered trustworthy."
In general, should we take MDE into consideration when deeming an AB test trustworthy or not? Let's say that the recommended test duration and sample size for each variant are reached, but the conversion uplift is below the MDE (e.g. MDE is 8%, but the conversion uplift is only 7%)? Should we accept the test results or not?
Tamas - yes, MDE is an important aspect of test trustworthiness. If you calculate power, test duration, and sample size AHEAD of running the study, you should also be able to accurately calculate the MDE. However, if you're doing post-test analysis, after the study has been run, it's very difficult to accurately calculate MDE based on sample size and power. In that case, a default MDE of 2-5% is considered acceptable. If the conversion uplift achieved (let's say 7%) is below the expected uplift (of 8% for example), you need to ensure the sample size requirements have been met in… Read more »
Thank you, Deborah! 🙂 Just to make it absolutely sure that I understand it: if the pre-calculated sample size has been met, but the conversion uplift (7%) is below the pre-calculated MDE (8%), should I consider the test trustworthy or not? Also, a slightly related question: what if the test result is not significant (p-value is above the pre-defined threshold) and the control and the treatment variants convert similarly (let's say 5.74% and 5.76% respectively)? Can I accept the treatment as the winner? I know that the answer is no, but the reasoning could be that the 2 variants convert… Read more »
Tamas - if you pre-calculate the MDE at 8%, but the actual uplift is in fact 7%, you'll want to make sure your sample size is large enough. For example, looking at this sample size calculator, if we assume a baseline conversion rate of 0.5% based on a relative MDE of 8% at 80% power and 5% alpha, the sample size requirement is 493,896 visitors/variant. However, when the MDE drops to 7%, the sample size requirement increases to 644,148 visitors/variant. The smaller the effect size, the larger the sample size needed to accurately detect that effect. So long as the… Read more »
Deborah - as always, thank you very much, I appreciate your insightful answers! Love your blog and keep up the good work!
The article is really good! Congratulations! I have a question about sample size calculation for continuous metric. Do you have any reference on this please?
Thanks Bruna! What, specifically, are you looking for with sample size calculations for continuous metrics?
For example, my experiment consists of optimizing billing. But when using this calculator (https://www.evanmiller.org/ab-testing/sample-size.html), which is great, the input parameters don't make sense anymore, because the "current effect" is, for example $100, and the "expected effect" is $200.
Bruna - If I'm understanding correctly, $100 would be considered the baseline. I'll assume $100 is Revenue Per Visitor (RPV). To get the conversion rate, you'd need divide $100 by the number of visitors paying that amount. Let's say 10,000 people. So your baseline RPV conversion rate would be 1% (100/10,000=0.01, O.01*100=1%). The relative percentage difference from $100 to $200 is the effect you're hoping to detect. That's a 100% gain, so the relative MDE would = 100. In Evan Miller's calculator, you'd plug those numbers in, and it would show you'd need a sample size of 1,767 people: https://www.evanmiller.org/ab-testing/sample-size.html#!1;80;5;100;1.… Read more »
That's right, perfect! Thank you so much!
I thought I should use another formula for calculating the sample size, like as "sample size for a two-sample t-test", so I asked about sample size for continuous metrics.
Glad the info was helpful for you!
Hi Deborah I have a question about calculating the length of time to do the test. Based on the calculations using https://cxl.com/ab-test-calculator/. I've arrived at: At least 6 weeks With at least 72,717 visitors/variant Based on a relative MDE of at least 35.33% Is this test worth doing at all with MDE above 5% (which the recommendation is to keep it below 5%?) I think you suggested calculating the sample size requirements ahead of time. Do we then use this calculator to calculate sample size requirements? https://www.evanmiller.org/ab-testing/sample-size.html If so, after using the calculator, i've arrived at a sample size of… Read more »
Angie - Yes, you should calculate the sample size requirements ahead of time, based on a historical or expected MDE. If you don't have either, go with an MDE of 2-5%.
The argument is, it's very unlikely a test will yield and effect of 5%+, so an MDE of 35.33% is highly unlikely.
Based on a baseline conversion rate of 0.15%, with a relative MDE of 35.33%, at a power of 80% and alpha of 5%, you'd need 88,023 visitors per variant.
If you went with a more realistic MDE of 5%, you'd need 4,210,997 visitors per variant.
Hi Deborah, Thanks for this insightful article! This is probably a dumb question, but: Does it matter which MDE I enter into my a/b testing tool? Background : Ihave very little experience with a/b testing as I only started very recently. At our company, we use a tool that allows you to enter the following parameters before running your test: runtime, confidence level (which I kept at 95%), power (which I kept at 80%), and MDE. I used the calculator you linked in your article to calculate runtime based on visitor numbers and conversions and I aimed for a very… Read more »
Hi Melanie - Yes, MDE is the Minimum Effect you expect to DETECT. The effect is the conversion difference. The detection is based on the values that arise after running the test; however, it's calculated ahead of time so that you know your sample size is large enough and your study is appropriately powered. So, the exercise of calculating the MDE is slightly speculative, but can be done based on historical data that shows typical effects achieved. If you've run the test for two weeks, ahead a 1.5% lift and have a large sample of over 150k visitors/variant, you should… Read more »
Hello, I have a question about whether it is possible to carry out a AB test where there are 2 primary metrics to optimise for. e.g. I have a webpage where users can perform 2 actions, and I want to make a change on the webpage to see if the conversion rate for both actions increases significantly. I'm not sure how to plug the various values into a calculator. for example, my webpage gets 34802 visitors a week, and the baseline conversion rate for the 2 actions are 0.91% and 5.6% respectively. How can I calculate a sample size and… Read more »
Hi John,
You'd have to plug the values into the calculator separately for each of the metrics then determine sample size calculations. The larger sample size requirement is the one you should go with for the test.
Hey Deborah, such a good article, thank you!
I wanted to ask you a question:
shown uplift 7% with 92% significance (running for 3 weeks) (required: 90% uplift)
MDE 9%
To get 7% uplift I should run a test for 5 weeks.
Should I extend the experiment for two more weeks?
What if I don't have time? Should I just stop it and say that it's flat? Or that there is a significant uplift, however, its power is lower?
Hi Victoria - Yes, it sounds like it would be prudent to run the test for another couple weeks. However, if you don't have time to do so, the results still hold true. They just may not be as trustworthy because the experiment may be somewhat underpowered.