

Last updated December, 2023
Written by Deborah O'Malley

Deborah O'Malley is a top A/B testing influencer who founded GuessTheTest to connect digital marketers interested in A/B testing with helpful resources and fun, gamified case studies that inspire and validate testing ideas.
With a special contribution from Ishan Goel

Ishan Goel is a data scientist and statistician. He's currently leading the data science team at Wingify (the parent company of VWO) to develop the statistical algorithms powering A/B testing. An avid reader and writer, Ishan shares his learnings about experimentation on his personal blog, Bagels for Thought.
Special thanks Ronny Kohavi

Ronny Kohavi is an esteemed A/B testing consultant who provided valuable feedback on earlier drafts of this article and raised some of the key points presented through his Accelerating Innovation with A/B Testing class and recent paper on A/B Testing Intuition Busters.
An astounding +364% lift in conversions, an enormous +337% improvement in clickthrough rate, and cruelly disappointing -60% drop in for submissions.
What do all these jaw-dropping conversion rates have in common?
They’re all extreme results!
And, as this article explains, they’re probably not real.
Because, according to something known as Twyman’s Law, any figure that's interesting or different is usually wrong.
The trustworthiness is suspect.
A great example of this concept comes from Ryan Thomas, co-founder of the optimization agency Koalatative.
He shared a seething sarcastic LinkedIn post announcing he had achieved a record-breaking +364% lift running a client A/B test:
Sounds impressive!
But, as Ryan, and others aptly explained, the tiny sample of 17 vs. 11 visitors, with 1 vs. 3 conversions, was so low, the results were incredibly skewed.
This extreme result is, unfortunately, not a one-off case.
In fact, as a learning exercise for experimenters, GuessTheTest recently published a similar case study in which the testing organization claimed to achieve a +337% conversion lift.
That’s massive!
But, taking a closer look at the conversion figures, you can see at just 3 vs. 12, the traffic and conversion numbers were so low, the lift appeared artificially huge:
And, according to Twyman's Law, makes the test trustworthiness suspect.
Okay, so you’re probably thinking, yeah, but these examples are of very low traffic tests.
And everyone knows, you shouldn’t test with such low traffic!
True.
But high traffic sites aren’t immune to this issue either.
In fact, in a study recently ran for a prominent SEO site -- with thousands of daily visitors -- one test yielded an extremely disappointing -60% drop in conversions.
However, on closer inspection, the seemingly enormous drop was the difference between just 2 vs. 5 conversions.
Although the page had thousands of visitors per variant, very, very few were converting.
And of those that did, there were far too few conversions to know if one version truly outperformed or if the conversion difference was just due to random chance.
The obvious problem with all these tests was the sample -- either the traffic and/or the conversion numbers -- were so low, the estimate of the lift was unreliable.
It appeared enormous when, in reality, it was just the difference between a few random conversions.
But, the problem is, you can get these kinds of test outcomes and still achieve statistically significant results.
Surprised?
Take this example of 3 vs. 12 conversions based on a sample size of 82 vs. 75 visitors.
As you can see, plugging the numbers into a statistical significance calculator shows the result is indeed significant at a 95% level of confidence with a p-value of 0.009:
Which goes to show: a test can appear significant after only a few conversions, but that doesn't actually equate to a trustworthy A/B test result.
How is this outcome possible?
As highly regarded regarded stats guru, Ronny Kohavi, explains in his class, Accelerating Innovation With A/B Testing, it’s all about the power.
A result can appear statistically significant, and in an underpowered experiment, the lift will be exaggerated.
Power measures the likelihood of accurately detecting a real effect, or conversion difference, between the control and treatment(s), assuming a difference exists.
Power is a function of delta.
Delta describes the statistical sensitivity or ability to pick up a conversion difference between versions.
This conversion difference is the minimum effect size, or smallest conversion difference, you want to detect.
Smaller values make the test more sensitive but require more users.
If these terms all seem a bit confusing, Ishan Goel, lead data scientist at the A/B testing platform VWO’s parent company, Wingify, offers a more relatable, real-life example.
He suggests you can best understand power, and its relationship to delta, by thinking of a thermometer used to detect a fever.
If you have a low fever, a cheap thermometer that's not very sensitive to slight temperature changes might not pick up your mild fever. It's too low-powered.
You need a thermometer that's very sensitive or high-powered.
The same is true in testing.
To accurately detect small conversion differences, you need high power. The higher the power, the higher the likelihood of accurately detecting a real effect, or conversion difference.
But, there’s a trade off. The higher the power, the larger the sample size also needs to be.
In turn, when sample sizes are low, power is reduced.
A test is what's known as underpowered when the sample is so low the effect, or conversion difference detected, isn't accurate.
All the examples we just saw were of low sample, underpowered tests.
Sure, the results may have been statistically significant. But the conversion rate was artificially skewed because the samples were so low the test wasn't adequately powered.
The sample – whether it be traffic, conversions, or both – was too low to be adequately powered.
The lower the power, the more highly exaggerated the effect.

Statistically significant, low-powered tests happen more than most experimenters would like to admit.
In fact, as highly regarded experimentation expert, Ronny Kohavi explains, because of the way statistics works, if you pick the standard alpha (p-value threshold) of 0.05, you’ll get a statistically significant result at least 5% of the time – whether there’s a true difference or not.
In those +5% of cases, the estimated effect will be exaggerated.
Here’s a document Ronny created showing this phenomenon:
With a p-value of 0.05, 1 in 20 experiments will be statistically significant even when there is actually no real difference between the control and treatment.
Ronny remarks that, for experienced experimenters running trustworthy tests, it’s rare to see lifts of more than a few percentage points.
In fact, Ronny recalls, in the history of Bing, which ran 10’s of thousands of experiments, only 2 impacted revenue by more than 10%.
He adds that it’s very unlikely that simple design changes, like in the examples above, can create over a 10% lift -- let alone a 20% gain!
It’s a lot more likely the lift is the outcome of a poorly designed, very underpowered experiment.
This phenomenon is known as the winner’s curse.
Statistically significant results from under-powered experiments exaggerate the lift, so the so-called "winning result" is not as rosy as initially believed.
The apparent win is a curse that becomes more worthy of a cry than a celebration.
Great. So, other than not running an experiment, how do you overcome the pitfalls of underpowered, low sample tests? 🤔
To answer this question, we’ve turned to several experts.
Here’s what they advise:
According to Ronny, the first and most important step is to do a power calculation before running the test.
Remember, power is the percentage of time the minimum effect will be detected, assuming a conversion difference actually exists.
A power of 0.80 (80%) is the standard.
This amount means you’ll successfully detect a meaningful conversion difference at least 80% of the time.
As such, there's only a (0.20) 20% chance of missing this effect and ending up with a false negative. A risk we’re willing to take.
To calculate power, you need to:
You now know you need at least 153,600 users, per variant, for the experiment to be adequately powered.
The lower the delta, the more users needed since you're trying to detect a smaller effect.
The opposite is also true. The higher the delta, the fewer users needed to detect a larger effect.
If this power calculation comes across as complex, the good news is, you can come at it another way and instead first calculate your required sample size.
After all, there are many ways to skin a cat.
But pay attention here: the key is to calculate your sample size AHEAD of running the experiment.
If you don’t, you may fall into the trap of stopping the test early if results appear significant -- even if the study is underpowered.
So. . . just how large of a sample do you need so your test isn't underpowered?
Here’s where it gets tricky. In true CRO style, it depends.
Some experimenters will tell you that, as a basic rule of thumb, you need at least 1,000 visitors per variant with at least 100 conversions per variant.
Others will say you need a whole lot more.
In this insightful Twitter post, Carl Weische, founder of the eCommerce testing agency, Accelerated – who has run thousands of successful experiments for clients – claims you need 20,000-50,000 users per variant and at least 1,000 conversions per variant:

Talk to other experiments and they may tell you otherwise.
So, really, across most experimenters, there’s no clear consensus. . .
Unless you do the math. Then, according to Ronny, you just need to know your variance and delta where the variance is p*(1-p) for conversion rate p.
But if formulas and math calculations leave your head spinning a bit, take heart.
You can also use a sample size calculator, like this one, to do all the hard work for you:

Here, you’ll just need to input:
So, in this example, assuming a baseline conversion rate of 4%, based on an MDE of 5%, with a standard power of 80% and a significance level of 5%, you’ll need a sample of 151,776 visitors per variant.
*Note, Evan Miller's calculator uses a slightly different value than 16 as the leading constant, so the estimates from his calculator are also slightly smaller.
The problem is, by relying on this calculator to determine the sample size, you now also need to consider and input the Minimum Detectable Effect, MDE (which is referred to as delta in the power formula above).
The MDE sounds big and fancy, but the concept is actually quite simple when you break it down. It's the:
But, now it becomes a bit of a catch-22 because sample size requirements change based on the MDE you input.
The lower the MDE, the greater the sample needed. And vice versa.
So, the challenge becomes setting a realistic MDE that will accurately detect small differences between the control and treatments you’re testing, based on a realistic sample.
Clearly, the larger the sample, the more time it will take to obtain it. So you also need to consider traffic constraints and what’s realistic for your site.
As a result, the MDE also presents a bit of an it depends scenario.
Every test you run may have a different MDE, or each may have the same MDE. There's no hard rule. It's based on your testing needs.
The MDE may be calculated from historical data in which you've observed that, in general, most tests tend to achieve a certain effect, so this one should too.
Or it can be a number you choose, based on what you consider worth it to take the time and resources to run an experiment.
For example, a testing agency may, by default, set the MDE at 5% because that's the minimum threshold needed to declare a test a winner for a client.
In contrast, a mature testing organization may set the MDE at 3% because, through ongoing optimization, eeking out gains any higher would be unrealistic.
As a rule of thumb, Ronny suggests setting the MDE in a range of 2-5%.
This maximum range of up to 5% is important to note because most underpowered studies show MDEs much higher.
As the organization grows or gets more traffic, you may want to lower this upper bound.
For an established company, or mature testing organization, a 1-2% MDE is realistic.
But it's hard to imagine an executive that doesn't care about big improvements to the business, so 5% is a reasonable upper bound.
This 5% upper limit exists because if you don't have the power to detect at least a 5% effect, the test results aren’t trustworthy.
However, take note, if you’re thinking your MDE should be 10% or higher, Ronny remarks it ain’t likely going to happen.
Most trustworthy tests -- that are properly powered -- just don't achieve that kind of lift.
In fact, Ronny recalls, across the thousands of experiments he was involved in, including at Bing, the sum of all relevant tests, over the year, was targeted at 2% improvement. A 3% improvement was a reason for true celebration!

If honing in on an MDE sounds like a highly speculative exercise that's going to leave you super stressed, don't worry!
You can simply use a pre-test analysis calculator like this one to determine the MDE for you:
And, if looking at this screenshot leaves you wondering how you’re possibly supposed to calculate all these inputs, here’s an in-depth GuessTheTest article outlining exactly how to use this calculator.
Note, this calculator is similar to Evan Miller's, referenced above, but gives you the MDE as a specific variable with the number of weeks you'll need to run the test making it a useful tool to calculate the MDE. The constant for this calculator is also different from Evan Miller's, so if you compare directly, you might get slightly different results.
With your MDE and sample size calculations worked out, the trick, then, is to:
If your pre-test sample size calculator shows you need thousands of visitors, and you only get hundreds per month, you'll want to consider whether the experiment is truly worth running since your data won't yield truly valid or significant results.
Additionally, Ronny cautions that, if you decide to proceed, a low sample test may give you statistically significant results, but the results may be a false positive and the lift highly exaggerated.
As this diagram (originally published in Ronny’s Intuition Busters’ paper) shows, when power is any lower than 10%, the effect, or conversion lift detected is incorrect up to half of the time!

So be aware of this pitfall before going into low sample testing.
And if your sample is low, but you still decide to test, Ishan Goel recommends focussing on making more pronounced changes that will, hopefully, create a bigger impact and create a larger, more measurable effect.
Conversely, as your traffic increases, you’ll get the luxury of testing more nuanced changes.
For instance, Google ran the famous 41 shades of blue experiment which tested the perfect shade of blue to get users clicking more. The experiment was only possible due to large traffic resulting in high-powered testing.
Assuming you plan ahead, pre-calculate your required sample size and input the MDE but still get surprising results, what do you do?
According to Ronny, in his paper A/B Testing Intuition Busters, extreme or surprising results require a lower p-value to override the prior probability of an extreme result.
Typically, a p-value of <0.05 is considered adequate to confidently declare statistically significant results.
The lower the p-value, the more evidence you have to show the results didn't just occur through random chance.
As Ronny explains in this post on p-values and surprising results, the more extreme the result, the more important it is to be skeptical, and the more evidence you need before you can trust the result.
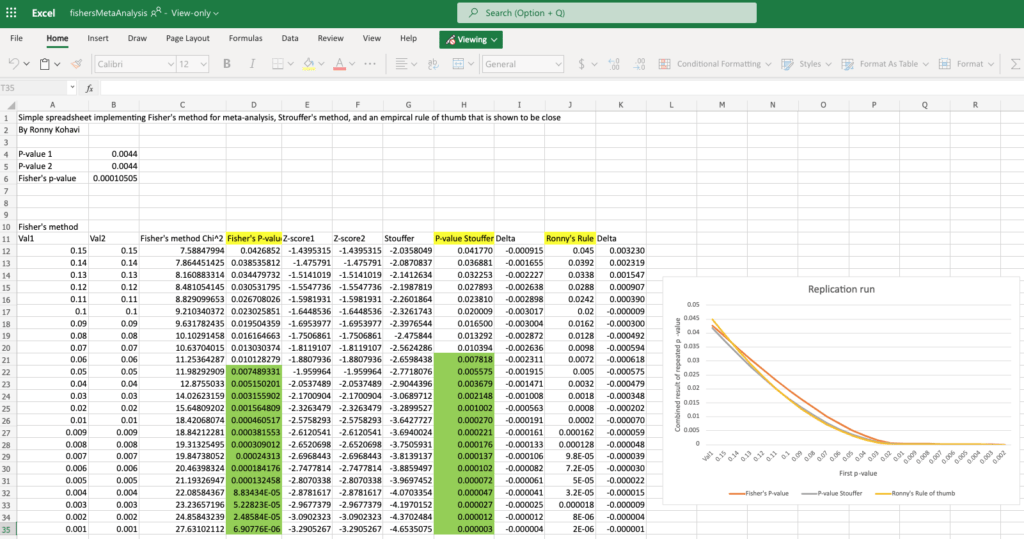
An easy way to get a lower p-value, Ronny details, is to do a replication run and combine the p-values. In other words, repeat the experiment and average the p-values obtained each time the experiment was run.
To compute the combined p-values, a tool like this one can be used.
As this example shows, if the experiment was run twice, and a p-value of 0.0044 was achieved twice, the combined p-value would be 0.0001. With this p-value, you could then declare, with greater certainty, that the results are truly significant:
But even with all these safety checks in place, you never can be quite sure test results will be completely accurate.
As Ishan aptly points out, it can be valuable to second-guess all findings and question anything that looks too good to be true.
Because, as Ishan says, “in experimentation, you can find ways to disprove the validity of a result, but you can never find a way to prove the validity of the result."
Or, as Maurice Beerthuyzen of the agency ClickValue puts it, it’s possible to put a cat in a tumble dryer, but that doesn’t mean it gives the right output:
So, the morale of the story is, don’t put cats in dryers. And don’t do low sample testing, underpowered testing – at least not without following all these checkpoints!
Hope this article has been useful for you in explaining the pitfalls of low sample testing – and how to avoid them.
Share your thoughts and comments below:
A primer explaining the 4 different types of tests you can run, what they mean, and how you can use each to improve your competitive testing advantage.
One of the most debated testing topics is how large does my sample size need to be to get trustworthy test results? Some argue samples of more than 120,000 visitors per variant are needed to begin to see trustworthy test results. Ishan Goel of VWO disagrees. What does he think is needed to get trustworthy test results? Listen to this webinar recording to find out.
To get users clicking your content, which format works best: buttons or links. A series of 8 real-life A/B tests suggests one format consistently outperforms. Can you guess which version wins? Checkout the mini meta analysis to find out.


Think it should be fixed 😉. Thanks for the post!
"The lower the delta, the
fewermore users needed since you're trying to detect a smaller effect.The opposite is also true. The higher the delta, the
morefewer users needed to detect a larger effect."